Regression model
- Multiple linear regression modeling is used for statistical prediction based on past forecasts for the statistical period.
- In such modeling, the predictand Y is related to the N predictors Xi. The predictand is estimated from a linear combination of predictors.
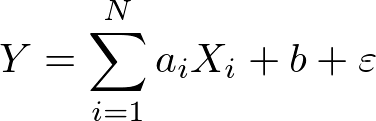
Here, ai represents the regression coefficients, b is the regression constant and ε is the error term.
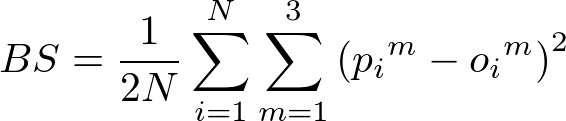
- The coefficients ai and the constant b are determined such that the sum of the squares of estimation errors is minimized.
- The analysis procedure is detailed below.
- Calculation of the factors ai and b is based on past observation data variables such as temperature and precipitation and on past forecast (i.e., hindcast) elements for the same period from the verification period (30-year statistical period (1991 - 2020) by default).
- Prediction of objective variables from real-time forecast elements multiplied by these factors is conducted using the relevant simultaneous equation.
- Mapping from the objective variable to three categorized forecasts based on the ranking is conducted.
- In the guidance tool, the probability density function (PDF) is assumed to have normal distribution.
Here the mean (xs) is a prediction value from the regression model and the standard deviation (σn) is the error of the model, assumed to be its RMSE based on hindcast data.
- Threshold values for the three categories are determined from past observation for the verification period (from 1991 to 2020 by default).
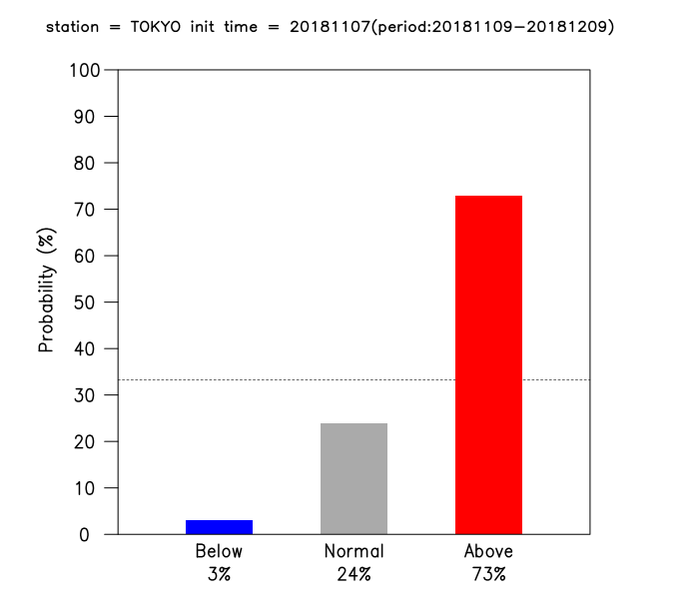
- Probability for each tercile category (below-, near- and above-normal) is calculated with reference to the PDF of guidance and the threshold values for the three categories.
- The cross-validation technique (Bishop 2006) is not used to create the regression model.
|
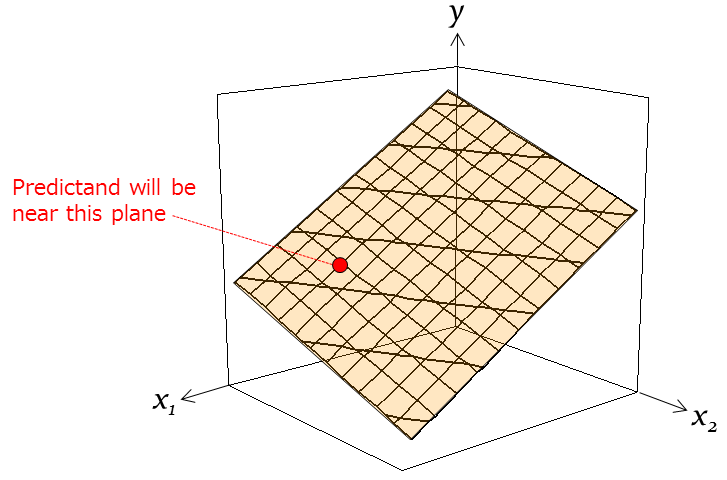
Conceptual diagram for a linear regression model of the predictand y and two predictors (x1 and x2).
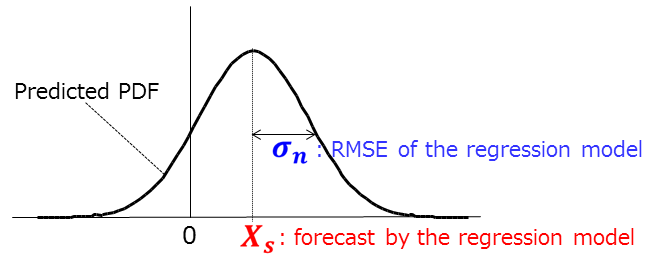
Sample of predicted PDF with normal distribution. xs and σn denote the mean forecast and the standard deviation, respectively.
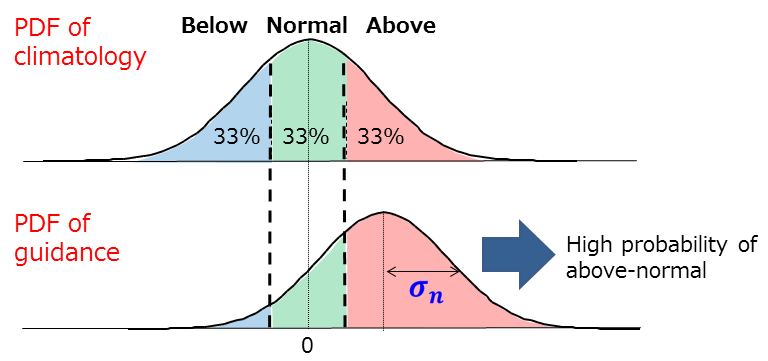
Sample climatorogical and predicted anomalous PDF for guidance forecasting.
|